
How to fetch historical price of cryptocurrency in CoinGecko
In the previous article on How to fetch real-time market price of cryptocurrency from CoinGecko in Python?, we explored how to fetch real-time market price of cryptocurrency via CoinGecko in Python. In this article, we will understand how to fetch historical market price of cryptocurrency from CoinGecko in Python.
At the end of the article, you will learn how to fetch historical price of one of more cryptocurrencies and finally draw line chart demonstrating the price variation over that period. As a use case, let us fetch the last 1-year historical price of BitCoin, Ethereum and Ripple and draw a line chart.
CoinGecko API Endpoints
In the previous article, we have extensively covered on CoinGecko free and premium accounts. Depending on whether you are using a free developer account or a premium account, the API endpoint also changes.
#Premium Account API URL
API_URL = r"https://pro-api.coingecko.com/api/v3/"

# Free Account API URL
API_URL = r"https://api.coingecko.com/api/v3/"
Fetch the historical market price of Bitcoin for last 12 months
Let’s say, we want to fetch the historical market price of Bitcoin for last 12 months in US dollars. The historical rate can be obtained using /coins/{id}/market_chart/range API endpoint where {id} is the API ID of the cryptocurrency.
#-------------------------------------------------
#   Fetch Historical Market Price of a crypto via CoinGecko
#-------------------------------------------------

import requests
import json

API_URL = r"https://pro-api.coingecko.com/api/v3/" #Premium Account API URL
API_URL = r"https://api.coingecko.com/api/v3/" # Free Account API URL

def get_historic_price(token:str, start_date:str, end_date:str)->list:
    url = f"{API_URL}/coins/{token}/market_chart/range"

    data = {} #Populate Parameters
    data['vs_currency'] = 'usd'
    data['from']= populate_date(start_date)  #Convert Date to UNIX Timestamp
    data['to']  = populate_date(end_date)

    headers = {}
    headers['Content-type'] = 'application/json'
    #headers['x_cg_pro_api_key'] = <API_KEY> #Applicable for premium account

    response = requests.get(url, headers=headers, params=data)

    crypto_info = response.json()
    #print(json.dumps(crypto_info, indent=4))

    crypto_prices = []
    for ind in crypto_info['prices']:
        temp = []
        date1 = datetime.fromtimestamp(ind[0]/1000.0)
        temp.extend([date1, ind[1]])
        crypto_prices.append(temp)

    return crypto_prices

end_date = datetime.now()
start_date = end_date - relativedelta(years=1)
crypto_prices = get_historic_price('bitcoin', start_date, end_date)

print(crypto_prices)
Notice the from and to attribute should UNIX timestamp indicating the start date and the end date of the time-span for which historical price is requested. The below code-snippet converts datetime object into UNIX timestamp.
import time
from datetime import datetime
from dateutil.parser import parse
from dateutil.relativedelta import relativedelta

#---------------------------------------
#   Convert Date to UNIX Timestamp
#---------------------------------------
def populate_date(date1):

    if isinstance(date1, datetime):
        return int(time.mktime(date1.timetuple()))
    elif isinstance(date1, str):
        date2 = parse(date1)
        return  int(time.mktime(date2.timetuple()))
    return None
You will a JSON response from the API request as shown below. Notice the response include historic price, market cap and volume. The first element in the prices section for instance, is the date in timestamp format and the second element is the market price at that time.
# JSON Response providing the historical price of price of BitCoin in US-Dollars.
# Notice the response, the first element in the prices section has date( in timestamp)
# and price in US-Dollars

{
    "prices": [
        [
            1652752980656,
            30014.09358296287
        ],
        [
            1652756518368,
            30064.841721262856
        ],
        [
            1652760093516,
            30415.908178918882
        ]
    ],
    "market_caps": [
        [
            1652752980656,
            569804748957.6514
        ],
        [
            1652756518368,
            571215283382.5037
        ],
        [
            1652760093516,
            579008131340.8501
        ]
    ],
    "total_volumes": [
        [
            1652752980656,
            28383173590.48121
        ],
        [
            1652756518368,
            27775603241.505165
        ],
        [
            1652760093516,
            28195876501.73888
        ]
    ]
}
Historic price of multiple coins in a Line Chart
Now that, we are familiar with fetching historical price of a single coin, let us extend this by getting the historical price of multiple coins and draw the line chart indicating the price variation over the last 12 month period. The /coins/{id}/market_chart/range API does not support multiple coins and/or currencies in the same API call. So, we need to make multiple API requests via a loop in order to get the historical price.
The final step is to draw a line chart and save the chart as an image from the historical price of all the coins. In order to draw a chart, we will use matplotlib, a visualization library extensively used in Python. If matplotlib is not installed, you can run the following command to install the package:
python -mpip install -U matplotlib
import os
import time
from random import randint
from datetime import datetime
from dateutil.relativedelta import relativedelta
import matplotlib.pyplot as plt
#-------------------------------------------------
# Fetch Historical Market Price of a crypto via
# CoinGecko for last 12 months and draw a line chart
#-------------------------------------------------
def create_line_chart(token_list):
end_date = datetime.now()
start_date = end_date - relativedelta(years=1) #Last 12 months
crypto_price = {}
for token in token_list:
crypto_price[token] = get_historic_price(token, start_date, end_date)
for crypto, prices in crypto_price.items():
x_axis = [ind[0] for ind in prices] #Date
y_axis = [ind[1] for ind in prices] #Crypto Prices
plt.plot(x_axis, y_axis, label=crypto)
plt.legend() #Show Legend
plt.title('Crypto Line Chart', fontsize=18) # Add Chart Title
plt.xlabel('Date', fontsize=12) # Add X-Axis
plt.ylabel('Price', fontsize=12) # Add Y-Axis
#plt.show() # Show the chart on the screen
rand_num = randint(100_000,999_999)
image_file = f"{os.getcwd()}/output/crpto_chart_{rand_num}.png"
plt.savefig(image_file, bbox_inches='tight') #Save the chart as an image
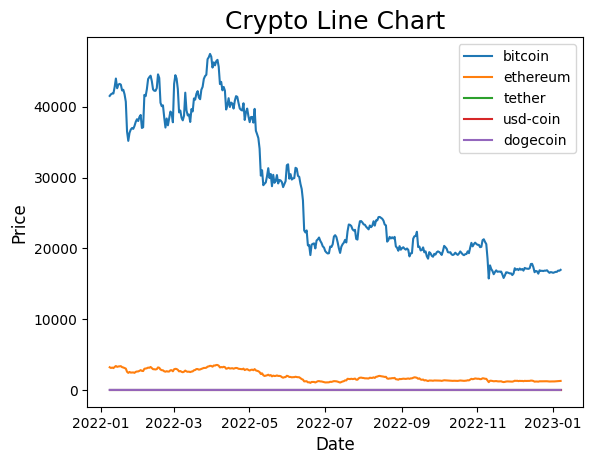
token_list = ['bitcoin', 'ethereum', 'tether', 'usd-coin', 'dogecoin']
create_line_chart(token_list)The line chart of BitCoin, Ethereum, DogeCoin and Tether from the historical price for last 12 months looks like below:
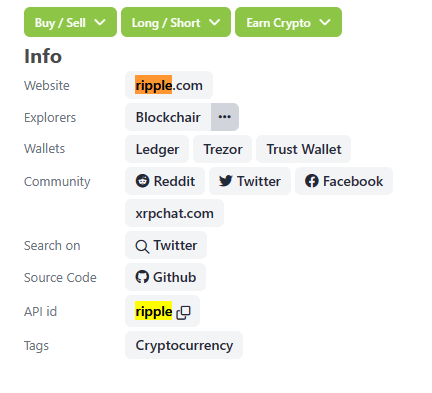
Finally, If you are not familiar with the id of the token, you can get the API id from the CoinGecko website. For instance, lets say you are not familiar with the API id of Ripple, then head over to CoinGecko website search for Ripple and click on the market information page. Under the Info section, you will find the API id of the token.
I hope you find this article helpful. The complete code to fetch real-time crypto price from CoinGecko can be downloaded from my GitHub account here: https://github.com/kirancshet/Get-Crypto-Historic-Chart-CoinGecko
As an exercise, can you explore the following:
- Get historical market price crypto price of BitCoin in Euros and get the highest price in the last 1 year and send an SMS. Please refer to my article here: How to send SMS via Twilio in Python?
- Get historical market price crypto price of BitCoin in Euros and get the highest price in the last 3 year and compute the percentage gain/loss from start date to end date.
834 total views, 2 views today